DNP Power Build-UP (Saturation) Cruve
A commonly performed DNP experiment is to record the NMR signal intensity with respect to the microwave power. The result is the DNP power saturation behavior.
In this example we will automatically record the DNP saturation curve for a sample of 10 mM TEMPO in water.
To record the DNP saturation experiment:
-
Select the PROTON experiment (seqfile=‘s2pul’) and set the NMR acquisition parameters ((nt, sw, tof, np, d1, pw, etc.) to some common values.
-
Connect the MPS TRIG output to the MPS Ext. Trig input using a BNC cable.
-
Go to the Start tab and select the MPS panel.
-
Select the DNP checkmark (under WG) in the MPS tab. This will set the waveguide switch to select the microwave path for DNP. A waveguide switch is commonly installed in systems that are based on an EPR spectrometer. Your system configuration may differ.
-
In the MPS panel, enter the microwave frequency. This is the same frequency that the EPR resonator is tuned to.
-
Select Ext. mode from the MPS mode dropdown menu.
-
We will use continuous microwave radiation during the experiment. To turn the microwave power on permanently during the experiment set the xm variable to the value ‘yyy’
1xm='yyy' -
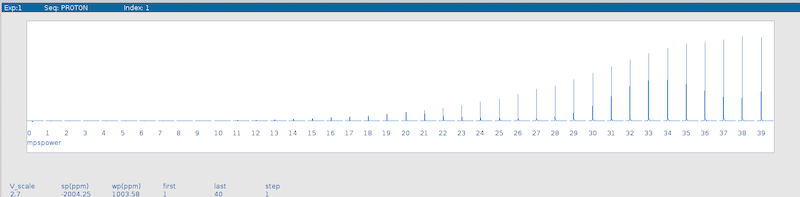
Next, we will create an array in OVJ with the microwave power values. For this the parameter mpspower needs to be arrayed. Create an array from 0 to 40 with a stepsize of 1, resulting in a total of 40 elements.
Note
Keep in mind a microwave power level of 0 dBm corresponds to 1 mW of microwave power, not 0 mW.
-
Start the experiment by clicking the go button or by typing the
gocommand in the OVJ terminal
Once the experiment is finished, the results can be conveniently displayed using the dssh command