Welcome to the online documentation of the Bridge12 QLP probe for pulsed dipolar spectroscopy. Bridge12 does not distribute paper manuals with their probes to keep the documentation always up to date. If you have questions, or suggestions for edits please contact us at info@bridge12.com.
Pulsed Electron Paramagnetic Resonance (EPR) spectroscopy using high-power microwave pulses or arbitrary waveform generated (AWG) broadband pulses require a large resonator bandwidth (low resonator Q) to avoid distortion of the pulse shape. However, large resonator bandwidth often comes at the cost of a reduced microwave conversion factor. Loop-Gap Resonators (LGR) combine all these desired features together with an excellent field homogeneity across the sample. This is especially important when using AWG generated broadband pulses.
At the heart of the probe is a Loop-Gap Resonator (LGR), with a large conversion factor, and an homogenous B1e microwave field across the entire sample volume to improve the performance of pulsed EPR experiments. The resonator is the ideal choice when using pulses generated by an Arbitrary Waveform Generator (AWG).
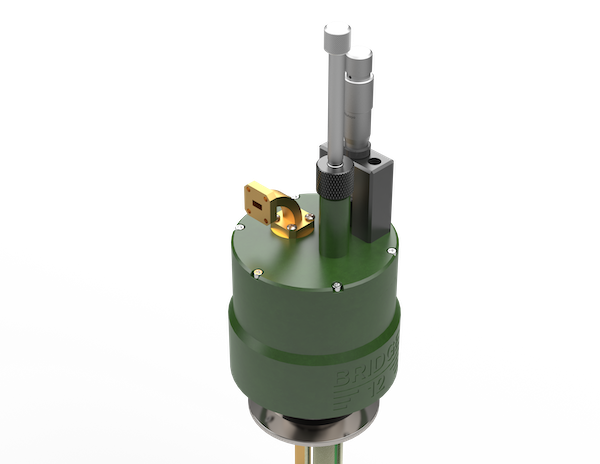
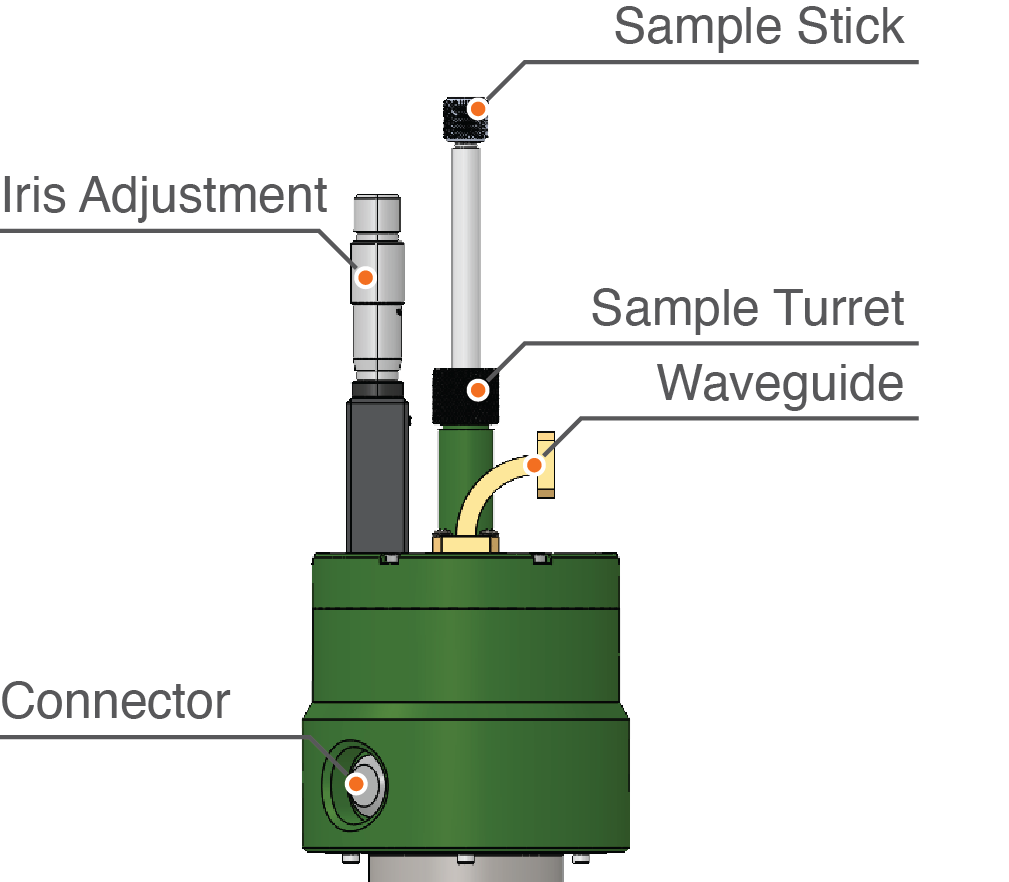
Bridge12 QLP Overview
An overview of the Bridge12 QLP probe is given in the figure shown above. For low-temperature measurements, the probe can be operated inside a cryostat. The Bridge12 QLP is compatible with commonly used cyrostats, such as the Oxford Instruments cryostat model CF935.
The main features of the probe are:
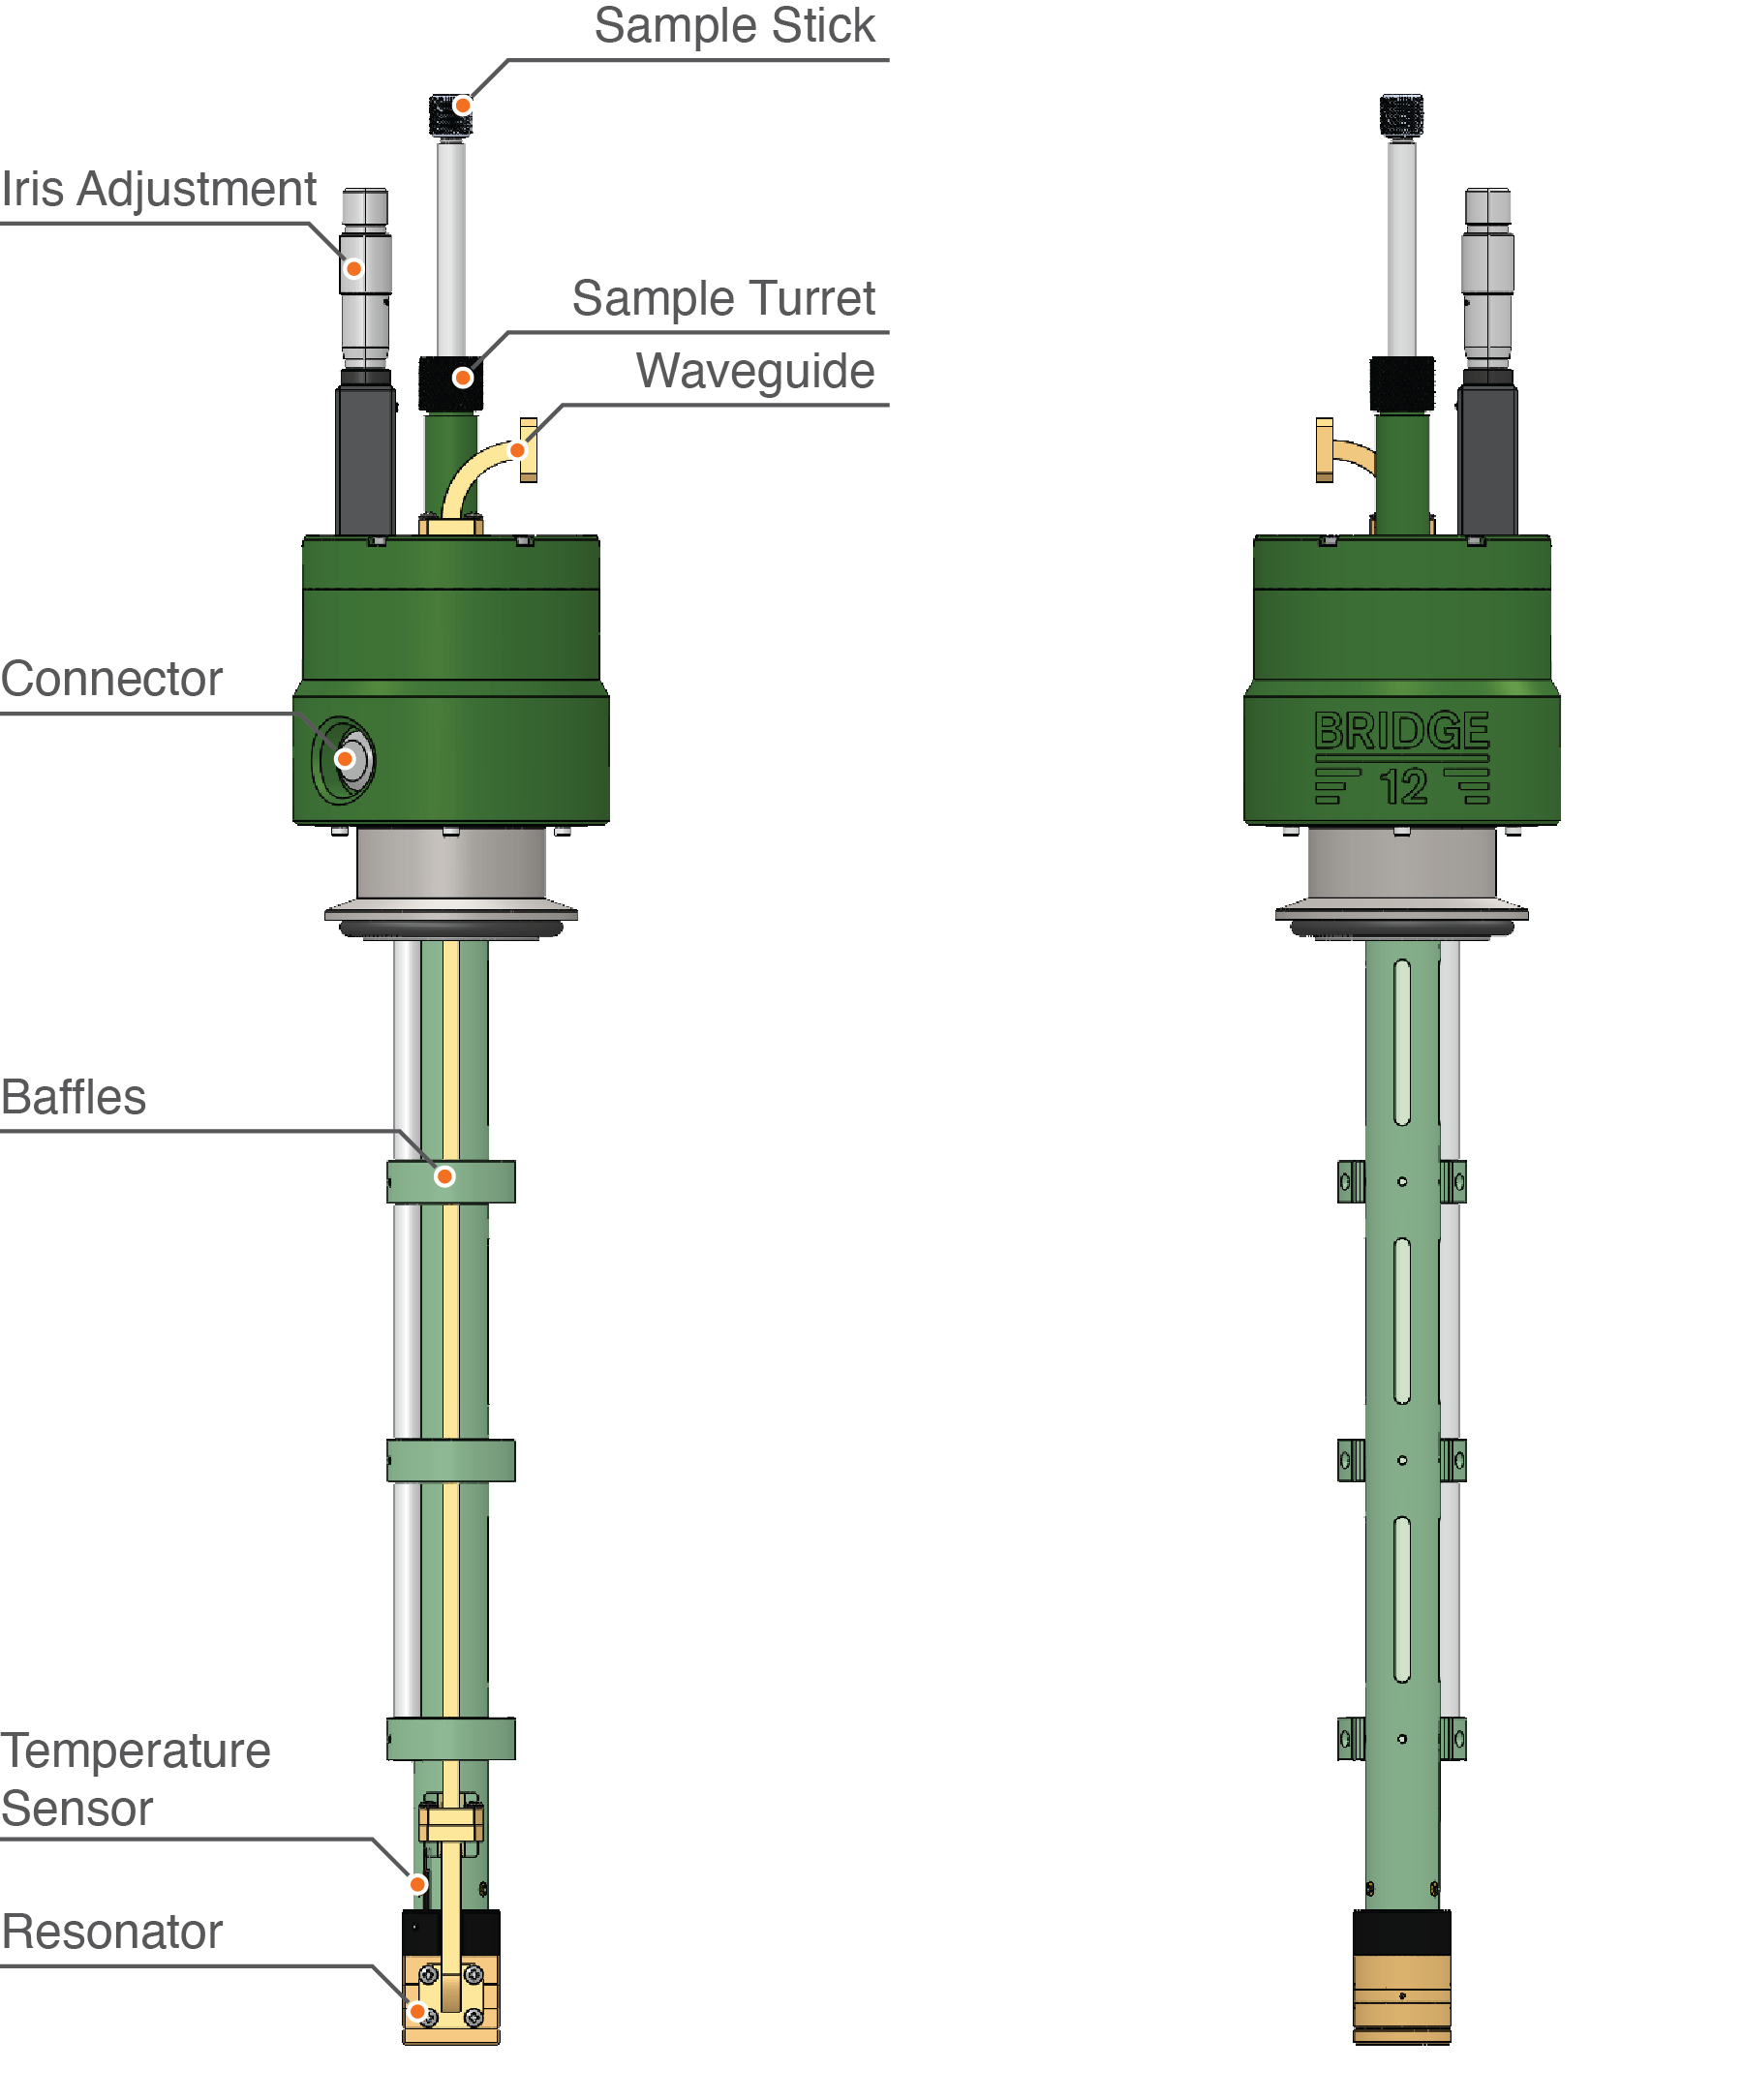
The resonator
Integrated temperature sensor
Baffles along the length of the probe
Electrical connector to connect the temperature sensor to a controller
The sample holder turret
WR-28 Waveguide connection
Iris adjustment
Optical Access
Optical access to the sample location for e.g. light/laser irradiation is possible in several different ways:
Through the sample holder/stick (for fiber access only).
Free-space access through the bottom of the resonator.
Free-space access perpendicular to the sample axis (please inquire with Bridge12 about this option).
If you like to use an optical fiber to irradiate the sample using the sample holder/stick (option 1), please contact Bridge12 at info@bridge12.com for further information.
Temperature Sensor
The Bridge12 QLP probe has a built-in, calibrated Cernox temperature sensor. The connector is located on the top of the probe. Please use the cable that came with the probe to connect the probe to the temperature controller.
More information about the pin-out can be found in the section Temperature Sensor.
A rectangular waveguide port (WR-28) is located at the top of the probe. The waveguide flange is a UG-599/U with 4 tapped holes, screw size #4-40. This waveguide port is used to connect the QLP probe to the EPR spectrometer. The probe waveguide has an integrated vacuum window to seal the probe to the atmosphere, when operating the probe at cryogenic temperatures.
Warning
Do not drop any screws or washers into the waveguide port. This could potentially damage the vacuum window located inside the waveguide.
If parts are accidentally dropped into the waveguide, do not use any sharp objects to retrieve the part. Instead, flip the probe over and gently shake the probe to remove the dropped item.
If a part got stuck inside the waveguide and you are not able to retrieve it, do not connect the probe to the spectrometer, and contact Bridge12 at info@bridge12.com.
Connecting the Probe to the Spectrometer
Important
Please make yourself familiar with the instructions below before attempting to install the probe. At no point should you use any force during the installation process. In general, all threads, screws, etc. are imperial size, not metric. Please use the appropriate tools to fasten all screws.
Please follow these steps to connect the probe to the spectrometer:
First time installation: Remove Kapton tape from waveguide flange (for shipping the waveguide port of the probe is protected by a strip of Kapton tape).
Place probe inside cryostat. If you don’t use a cryostat, place probe in the appropriate support structure.
Turn/orient the probe so the waveguide port is located to the left. The waveguide port should be on the side that provides the shortest distance to the EPR bridge. Typically, the EPR bridge is located to the left of the probe.
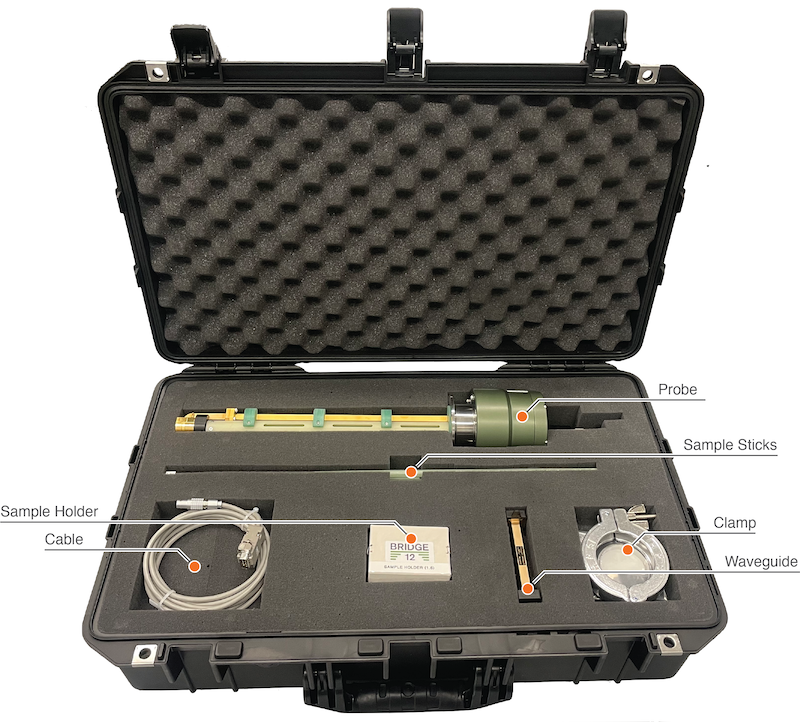
To connect the probe to your EPR instrument, the probe comes with additional waveguide components:
WR-28 straight waveguide section, 4 in. length
WR-28 E-bend, 1.5 in.
#4-40 screws, 3/8 in.
In addition to these parts, please also use the flexible WR-28 waveguide section provided with the EPR instrument to connect the probe to the spectrometer.
Every EPR instrument is slightly different. Here are different scenarios to connect the probe.
Place the E-band on top of the probe, and use the flexible waveguide to connect the probe to the spectrometer.
First add the straight section to the top of the probe and cover the rest of the distance with the flexible waveguide.
Caution
When connecting two waveguide sections, always orient the waveguides so that the long section of both waveguides are parallel to each other.
Once the waveguide is connected, connect the temperature sensor to the temperature controller.
For the Bridge12 QLP-1.6 mm please use a sample capillary with a maximum OD of 1.6 mm. A link to the sample tube vendor can be found on the Cosumables Page.
Mounting the Sample
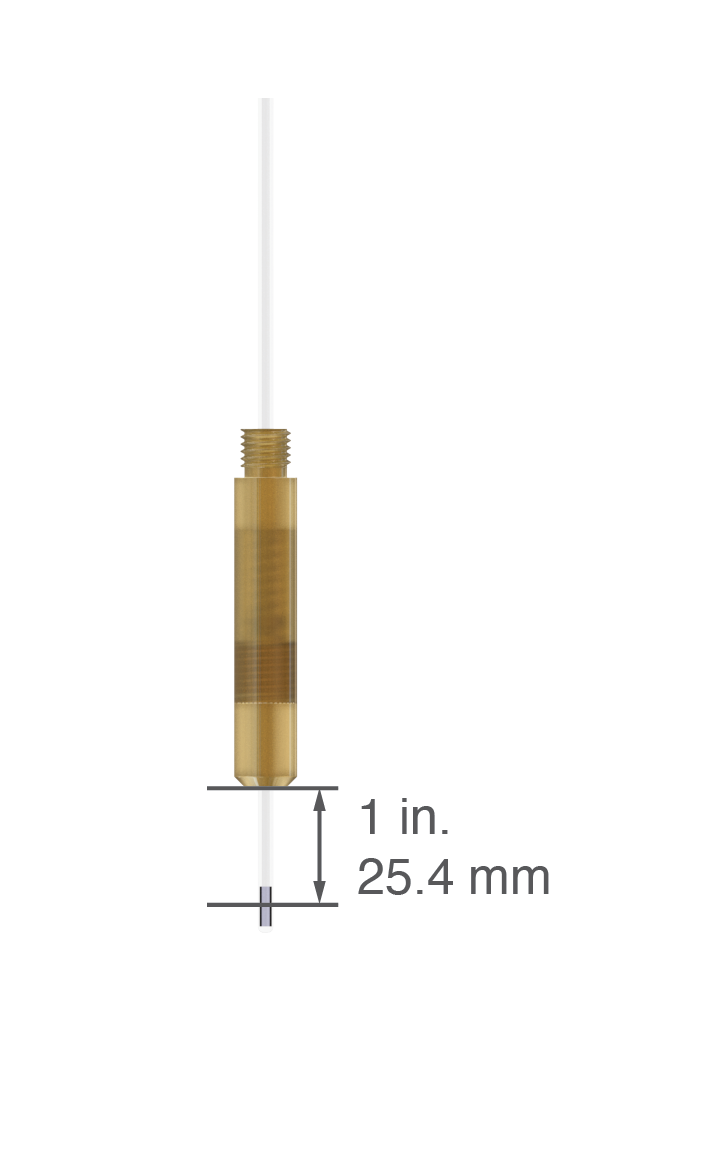
Please follow the instructions for using the sample stick to mount the EPR sample to the Sample Stick. In general, the distance between the center of the sample and the bottom of the sample holder should be about 1 inch (25.4 mm) (see figure below).
Recommended distance between the center of the sample and the bottom of the sample holder
Inserting the Sample Stick
To insert the sample stick into the probe follow these instructions:
Note
Please keep in mind that these instructions can differ, depending on the type and make of the low-temperature cryostat.
If the cryostat is cooled down, stop the cooling. Wait for the pressure inside the cryostat to reach atmospheric pressure.
If using a purge gas, switch on a slow stream of purge gas.
Loosen the nut at the top of the sample turret (see figure above). Depending on the probe the nut may be made from brass, stainless steel, or anodized aluminum. Typically, just loosen the nut should be sufficient, it is not necessary to completely remove the nut.
Pull out previous sample stick or blind plug. If the purge gas is running, there should be no ambient air entering the cold space of the cryostat.
Insert the new sample stick (or blind plug).
Push sample stick all the way to the bottom. If the distance between the center of the sample and the bottom of the sample holder is 1 inch, the bottom of the sample holder will rest on top of the resonator.
Tighten the nut at the top of the sample turret. Please don’t use any tools to tighten the nut.
Start the cooling and wait for the temperature to settle before attempting to tune the resonator.
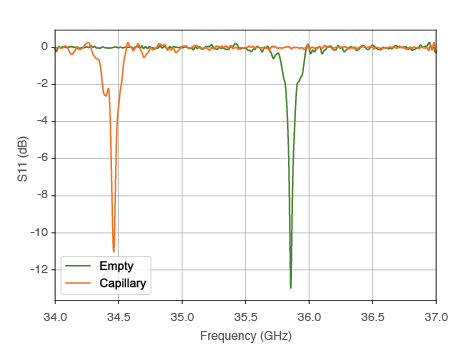
The frequency of the empty resonator is typically between 35.5 and 36 GHz. This may be outside of the normal operating frequency of a typical EPR spectrometer, however, inserting the sample into the resonator, this will shift the frequency to lower values (dielectric loading) as shown in the figure below. The amount of the frequency shift depends on the size and material of the sample capillary and the nature of the sample (e.g. polymer at room temperature, frozen aqueous solution, etc.). Please see the section Consumables for the recommended sample size.
QLP Frequency Shift
Due to the nature of the resonator, the resonance frequency will not noticeably change when cooling down to cryogenic temperatures.
Important
If you have already samples that are loaded into a smaller capillaries, we recommend placing the existing capillary into the WG-221T-RB sample tube to shift the resonator frequency to the correct regime.
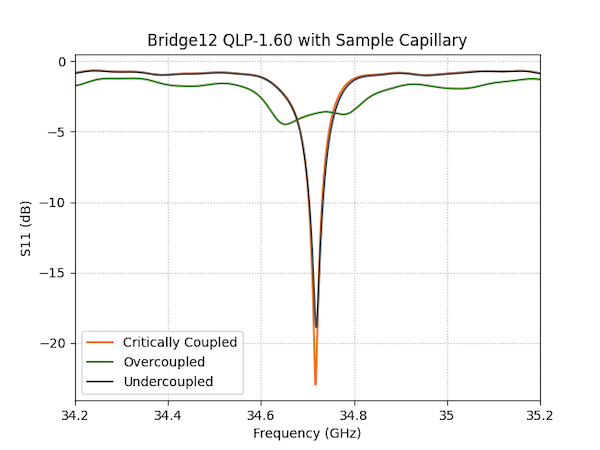
Iris Coupling
The microwave coupling to the resonator is adjusted using an iris. The iris can be mechanically controlled using a micrometer screw head, located at the top of the probe (Iris Adjustment, see figure above). By turning the micrometer screw, the iris is moved up and down and the resonator coupling can be changed from undercoupled to critically coupled to overcoupled as shown in the figure below.
QLP Iris Adjustment
Typical Q values and conversion factors for the overcoupled and critically coupled resonator:
Parameter
Value
Microwave Conversion Factor (critically coupled)
> 12 G/sqrt(W)
Bandwidth (critcially coupled)
Q ~ 300 - 400 (85 - 113 MHz)
Microwave Conversion Factor (overcoupled)
> 5 G/sqrt(W)
Bandwidth (critcially coupled)
Q < 85 (> 400 MHz)
To achieve the largest resonator bandwidth, the iris should be at its highest position. However, in some circumstances it may be beneficial to lower the iris to increase the B1e field strength, at the expense of the resonator bandwidth.
Warning
Critically coupling the resonator can lead to significant probe ring-down, with power reflected back to the EPR spectrometer exceeding safe levels. When attempting to critically couple the resonator, make sure to start a low and safe level of excitation power.
Adjusting the Iris Coupling
To adjust the coupling of the resonator, follow these steps:
Lower the micrometer iris adjustment to the minimum position (down) by turning the micrometer head clockwise. Once the iris is in its lowest position, the resonator will be critically coupled. Do not force the iris mechanism, especially at cryogenic temperatures.
Change the spectrometer frequency so the resonator dip is all the way to the right. Inserting the sample will cause the frequency to shift to a lower level.
Insert the sample holder into the resonator.
While inserting the sample, follow the tuning dip. If necessary, adjust the spectrometer frequency, so the dip is not moving outside the observable region.
Make sure the sample stick is lowered all the way into the probe.
Raise the iris by turning the micrometer screw counter clockwise until the desired bandwidth is obtained.
Raising the iris (turning the micrometer screw counter clockwise) will lower the Q-value and increase the resonator bandwidth (see figure above) without changing the resonator frequency.
References to pulsed dipolar EPR spectroscopy and articles citing the QLP probe
References Specific to the Bridge12 QLP Probe
List of links to scientific publications in which the Bridge12 QLP resonator was used:
Hasanbasri, Zikri, Nicholas A. Moriglioni, and Sunil Saxena. “Efficient Sampling of Molecular Orientations for Cu(II)-Based DEER on Protein Labels.” Physical Chemistry Chemical Physics, March 15, 2023. https://doi.org/10.1039/D3CP00404J.
General References
The field of pulsed dipolar spectroscopy is rapidly evolving. Below, find some general literature references for dipolar spectroscopy and the required instrumentation.
Reviews/Books:
Goldfarb, Daniella. “Pulse EPR in Biological Systems – Beyond the Expert’s Courtyard.” Journal of Magnetic Resonance 306 (September 2019): 102–8. https://doi.org/10.1016/j.jmr.2019.07.038.
Tsvetkov, Yuri D., Michael Bowman, and Yuri Grishin. Pulsed Electron–Electron Double Resonance: Nanoscale Distance Measurement in the Biological, Materials and Chemical Sciences. Springer International Publishing, 2019. https://doi.org/10.1007/978-3-030-05372-7.
Borbat, Petr P., and Jack H. Freed. “Multiple-Quantum ESR and Distance Measurements.” Chemical Physics Letters 313, no. 1–2 (November 1999): 145–54. https://doi.org/10.1016/S0009-2614(99)00972-0.
PELDOR:
Milov, A. D., A. B. Ponomarev, and Yu. D. Tsvetkov. “Electron-Electron Double Resonance in Electron Spin Echo: Model Biradical Systems and the Sensitized Photolysis of Decalin.” Chemical Physics Letters 110, no. 1 (September 14, 1984): 67–72. https://doi.org/10.1016/0009-2614(84)80148-7.
SIFTER:
Jeschke, G., M. Pannier, A. Godt, and H. W. Spiess. “Dipolar Spectroscopy and Spin Alignment in Electron Paramagnetic Resonance.” Chemical Physics Letters 331, no. 2 (December 1, 2000): 243–52. https://doi.org/10.1016/S0009-2614(00)01171-4.
Q-Band LGR Resonators
Denysenkov, Vasyl, Philipp van Os, and Thomas F. Prisner. “Q-Band Loop-Gap Resonator for EPR Applications with Broadband-Shaped Pulses.” Applied Magnetic Resonance 48 (December 1, 2017): 1263–72. https://doi.org/10.1007/s00723-017-0930-9.
Tschaggelar, Rene, Frauke D. Breitgoff, Oliver Oberhänsli, Mian Qi, Adelheid Godt, and Gunnar Jeschke. “High-Bandwidth Q-Band EPR Resonators.” Applied Magnetic Resonance 48 (December 1, 2017): 1273–1300. https://doi.org/10.1007/s00723-017-0956-z
RIDME:
Kulik, L. V., S. A. Dzuba, I. A. Grigoryev, and Yu. D. Tsvetkov. “Electron Dipole–Dipole Interaction in ESEEM of Nitroxide Biradicals.” Chemical Physics Letters 343, no. 3 (August 3, 2001): 315–24. https://doi.org/10.1016/S0009-2614(01)00721-7.
Milikisyants, Sergey, Francesco Scarpelli, Michelina G. Finiguerra, Marcellus Ubbink, and Martina Huber. “A Pulsed EPR Method to Determine Distances between Paramagnetic Centers with Strong Spectral Anisotropy and Radicals: The Dead-Time Free RIDME Sequence.” Journal of Magnetic Resonance 201, no. 1 (November 2009): 48–56. https://doi.org/10.1016/j.jmr.2009.08.008.
Abdullin, Dinar, Fraser Duthie, Andreas Meyer, Elisa S. Müller, Gregor Hagelueken, and Olav Schiemann. “Comparison of PELDOR and RIDME for Distance Measurements between Nitroxides and Low-Spin Fe(III) Ions.” The Journal of Physical Chemistry B 119, no. 43 (October 29, 2015): 13534–42. https://doi.org/10.1021/acs.jpcb.5b02118.