The following section gives an overview how to start OVJ, tune the probe to the correct frequency, and how to acquire a simple 1D 1H NMR spectrum.
This is the multi-page printable view of this section. Click here to print.
Getting Started
- 1: Launching OVJ
- 2: Tuning the Probe
- 2.1: Using the nanoVNA
- 3: Acquiring a Proton Spectrum
- 4: Saving the NMR Spectrum
1 - Launching OVJ
Launching OVJ
OVJ can be launched in two different ways: 1) by double-clicking the vnmrj icon on the desktop or, 2) by opening a terminal window and launching it from the command line by typing:
|
|
Setting the Spectrometer Frequency
If this is the first time you are using OVJ, the spectrometer frequency has to be set to the correct value.
Note
The first time you launch OVJ the spectrometer frequency has to be set. Once the spectrometer frequency has been set the value will be stored by OVJ and does not have to be entered every time the user starts OVJ.
In OVJ, the spectrometer is historically set by setting the frequency of the deuterium (2H) lock frequency.
The ratio between the (1H) and (2H) frequency is approximately 6.51. For example, to set the spectrometer to a 1H frequency of 14.5 MHz the user has to set the spectrometer frequency to 14.5/6.51 = 2.227 MHz. To set the spectrometer frequency:
-
In OVJ go to Edit -> System Settings

-
In the window that appears enter the deuterium (2H) lock frequency in MHz.
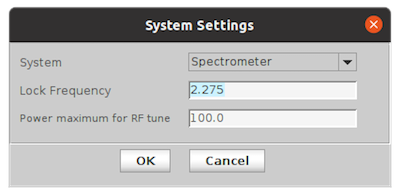
Alternatively, the spectrometer frequency can be set from the OVJ command line using the lockfrequency parameter:
|
|
Next, you are ready to Tune the Probe.
2 - Tuning the Probe
Warning
The following section describes how to tune the NMR probe to the correct spectrometer frequency. This requires disconnecting the NMR probe from the spectrometer.
Make sure all experiments have been finished and no pulses are transmitted anymore before disconnecting the NMR probe from the spectrometer.
Tuning the NMR Probe
To tune the NMR probe to the spectrometer frequency follow these steps:
- Note down the spectrometer frequency. This does not have to be an exact value, but should be close (within 0.1 MHz of the operating frequency).
- Switch on the nanoVNA and set the center frequency to the spectrometer frequency (set it to the frequency of the nucleus you want to observe, not the 2H lock frequency). Set the span to a value of 1-2 MHz.
Note
See the page Setting up the Display to configure the nanoVNA for S11 measurements.
For instructions on how to setup the center frequency, span, marker position, etc. see the page with the setup instructions for the nanoVNA.
If this is the first time using the nanoVNA you should calibrate the device. This calibration needs to be repeated every time you change the center frequency or span.
- Disconnect the NMR probe from the Bridge12 SCN spectrometer and connect it to channel 0 (CH0) of the nanoVNA.
- You should see a ‘Tuning Dip’ on the nanoVNA. If you do not see a tuning dip try one of the following things:
- Increase the span of the VNA to scan a broader frequency range
- Change the matching on your probe
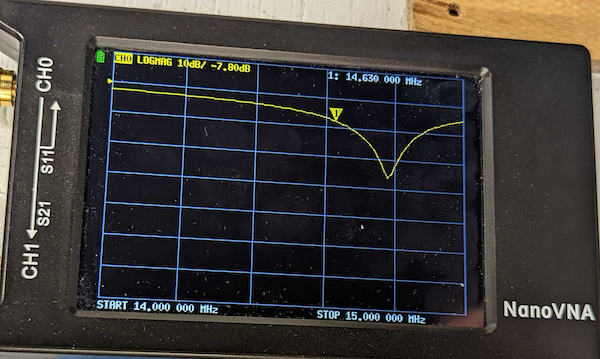
- Use the slider at the top of the nanoVNA to move the marker to the spectrometer frequency (within +/- 0.1MHz). The marker will tell you the absolute value of the S11 parameter at the spectrometer frequency (see image below, S11 = -7.8 dB).
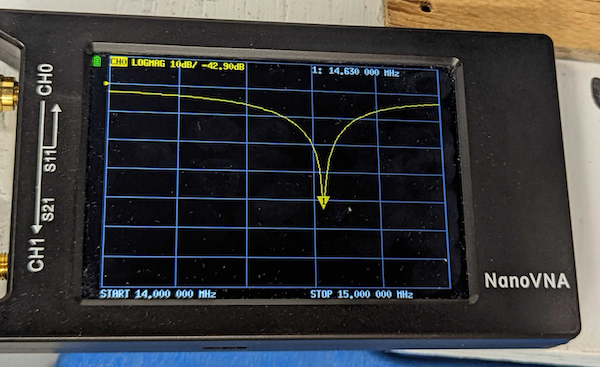
- Turn the tune and match capacitor of your probe to achieve a minimum reflection. In general, the tune capacitor will shift the dip up in down with frequency, while changing the match capacitor value will increase the depth of the dip. Optimize both capacitor values for a minimum in reflected power. The probe is tuned once you achieve the lowest value for S11 (see image below, S11 = -40.9 dB)
Next, you are ready to Acquire an NMR Spectrum.
2.1 - Using the nanoVNA
The Bridge12 SCN is delivered with the nanoVNA, a pocket-size vector network analyzer (VNA) to tune the probe to the transmitter frequency of the spectrometer.
The nanoVNA has two channel and has many different ways to display the (complex) S parameters. However, in the following we provide a brief set of instructions to setup the nanoVNA display to:
- Only show the reflected power from the probe (S11)
- How to calibrate the nanoVNA.
The nanoVNA will store these settings, so you only have to go once through these instructions.
For a complete reference please visit the nanoVNA Webpage.
Note
To navigate through the different menus of the nanoVNA you can either use the wheel located at the top of the device or using the touch screen. The touch screen is best used with a stylus pen.
Setting up the Display
To setup the display:
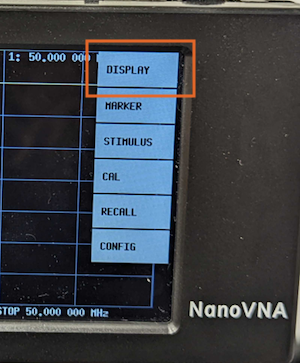
- Tap the touchscreen to show the menu
- Tap the Display button (top right corner)
- Tap the Trace button on the display
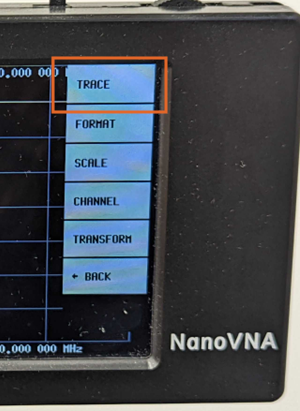
- For convenience, select only Trace 0 by tapping on it. The selected trace is highlighted with a colored background (yellow for Trace 0). Unselect any other traces by tapping on the button.
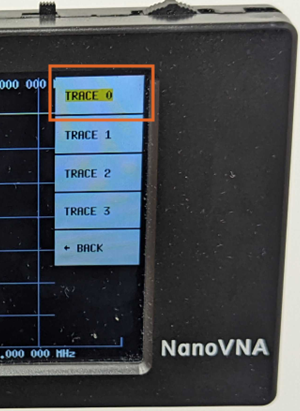
- To leave the menu tap somewhere on the touchscreen.
Setting the Frequency Range
- Tap on the touchscreen to show the menu
- Tap on the Stimulus button
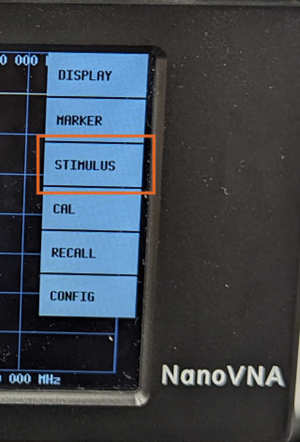
- Next, tap the Center button
- On the next screen, enter the spectrometer frequency using the number pad and press the M button to indicate that the entered frequency is given in MHz.
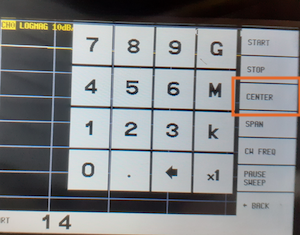
- Next, tap the Span button and enter the frequency range to observe the resonator tuning dip. Typically 1-2 MHz is a good range to start with.
Calibrating the nanoVNA
Important
The nanoVNA should be calibrated frequently. The calibration is only valid for a given set of parameters (e.g. span, center frequency, number of points ….). If one of these parameters is changed, the device needs to be recalibrated.
The device will still work even with a calibration that is “slightly off”. For example, the spectrometer frequency will not change drastically on a day to day basis and using the same configuration is ok. However, if you require accurate values for S11 we recommend calibrating the device before taking the measurement.
We recommend calibrating the device once and then not changing the measurement parameters. This should be good for a day-to-day operation.
The nanoVNA is calibrated using a basic OPEN-SHORT-LOAD protocol. Three SMA connectors are included with the nanoVNA, used for calibrating the device (see image below).
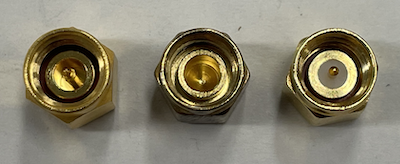
- SHORT - Left, used to shorten the input of the VNA. This connector is all metal on the inside.
- OPEN - Middle, used to create an open port. This connector does not have a middle pin.
- LOAD - Right, used to simulate a 50 Ω load. This connector has a middle pin and a white teflon ring around it.
To calibrate the nanoVNA:
- Set the center frequency and span to the desired range by following the instructions above.
- Tab the Cal button on the display
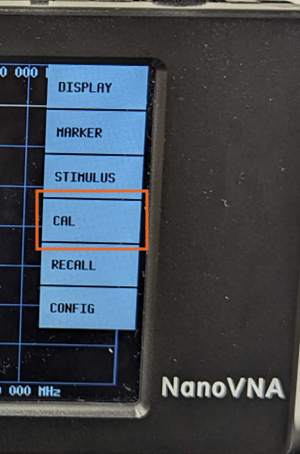
- Connect the OPEN standard to the CH0 port and press ‘Open’
- The open entry is now black underlined
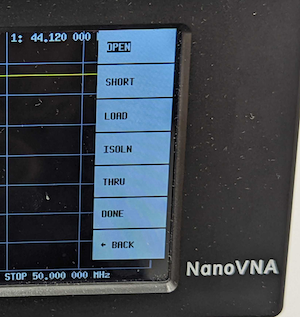
- Connect the SHORT standard to the CH0 port and press ‘Short’
- Connect the LOAD standard to the CH0 port and press ‘Load’
- Press ‘Done’
The nanoVNA is now calibrated.
Charging the Battery of the nanoVNA
From time to time the nanoVNA battery needs to be recharged.
To recharge the battery connect an USB-C cable to the nanoVNA and plug the cable either into a USB charger or a computer.
3 - Acquiring a Proton Spectrum
This section provides a brief overview how to acquire a 1D
- OVJ-B12 is installed on the computer
- The hardware is set up properly
- A sample is inserted into the probe
- The NMR probe is tuned to the spectrometer frequency.
Acquiring a 1H NMR
-
From the protocols tab drag the PROTON experiment into the plotting window, or double click on the PROTON protocol.
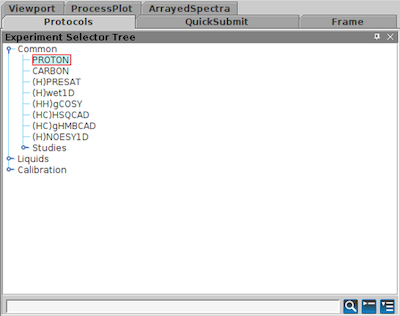
Alternatively, the pulse sequence can be set using the OVJ command line:
1seqfil='s2pul'The PROTON sequence calls a pulse program s2pul. This is a general, two-pulse sequence used to run variety of different experiments such as a single pulse NMR experiment or an inversion-recover sequence.
-
Next, the user has to set the length and power of the RF pulse to properly acquire a 1D 1H spectrum. In OVJ the pulse parameters can be changed from the OVJ command line or from the acquisition panel.
Note
Make sure that the spectrometer frequency is set correctly. The spectrometer frequency is set by adjusting the lockfreq. For experiments at 14.79 MHz, this parameter has a value 2.271 MHz (2H frequency corresponding to a 1H frequency of 14.78 MHz). This value should be ideally set to a precision of three to four significant digits.
See the Launching OVJ section in the Getting Started section for more details.
The length of the observe pulse is given by the parameter pw. From the OVJ command line set the pulse length:
|
|
corresponding to a pulse length of 3 µs.
Note
If the pulse length corresponding to a 90 degree pulse is unknown, it can be determined by performing a nutation experiment to calibrate the correct pulse length. Typically, the probehead manufacturer will provide the length and power level for the 90 degree pulse.
-
Next some of the acquisition parameters need to be set. Go to the Acquire tab and click on Acquisition. Here, basic acquisition parameters can be adjusted. Alternatively, the values can be entered in the OVJ command line.
- Spectral Width: Parameter sw
- Acquisition Time: Parameter at
- Complex Points: Parameter np
For example
1 2sw=50000 np=4096will set the spectral width to 50000 Hz (50 kHz) and the number of points acquired in the time domain to 4096.
Note
In OVJ the number of points corresponds to the total number of real and imaginary points. To acquire a total of 2048 (complex) points, np has to be set to 4096 (twice the number of complex points).
-
Set the number of transients (
nt) to 4. In general, OVJ will add a CYCLOPS phase cycle to each sequence automatically to remove DC offsets and correct for phase imbalances. Therefore, the parameterntshould always be set as a multiple of 4.1nt=4 -
On the Acquire tab click Channels to set the transmitter offset
tofparameter. To get started, set this value to 01tof=0With the transmitter offset set to 0, the spectrum, if excited on resonance, appears in the center of the window. To center the spectrum adjust the
tofvalue. Alternatively, you can click with the mouse on the peak (single red line cursor) and enter the commandmovetofin the OVJ command line. OVJ will automatically adjusttofso that the NMR spectrum in the next acquisition is at the center of the window. -
Start the acquisition by either pressing the GO button or by typing
1goin the OVJ command line. The acquisition will start and the data is displayed and processed on the screen.
Note
In OVJ the acquisition of the NMR spectrum can be started using the go or ga command. In this version of OVJ the two commands are identical. This may be different on other (older) NMR spectrometers running vnmrj.
Phasing a spectrum
Once the acquisition is finished, the spectrum most likely needs to be phased to show just the real part of the complex spectrum (see figure below). This can be done automatically using the autophase command aph or manually.

Using the Autophase Routine
To autophase the spectrum type the following command in the OVJ command line and press enter:
|
|
to autophase the spectrum.
Manually Phasing the Spectrum
Sometimes, the autophase routine fails and the spectrum needs to be phased manually. To manually phase an NMR spectrum:
-
Click the Phase button in the toolbar to the left

-
Click the spectrum with the left mouse button and keep the button pressed. Two red cursors appear to the left and right of the peak. Phase the peak by moving the mouse up and down. This will adjust the 0th order phase correction (frequency-independent phase correction). Alternatively, the phase can be adjusted from the OVJ command line by typing:
1rp=11.5 -
To adjust the 1st order phase correction (frequency-dependent phase correction) click the Phase button in the toolbar to the left. Next, select the peak by moving the mouse cursor to the NMR peak and click the right mouse button. The point selected is the pivot point used to adjust the 1st order phase correction. By moving the mouse up and down the phase of the rest of the spectrum can be adjusted. To adjust the 1st order phase correction
lpfrom the OVJ command line type:1lp=157
The proper phased spectrum is shown below.

Note
Start phasing the spectrum with rp and lp set to 0. First, adjust the 0th order phase and then the 1st order phase correction. Note that rp=360 is equivalent to rp=0. This is also true for lp.
Next, proceed to the next section to Save the NMR Spectrum.
3.1 - Processing 1D Spectra in DNPLab
DNPLab is a Python package to process NMR data. The software was developed by Bridge12 and is open-source, free to use. DNPLab can be used for offline processing of OVJ data.
Below, a brief example is shown how to load and process a 1D NMR spectrum. For a complete reference and many more processing examples visit the DNPLab Online Documentation.
Installling DNPLab
DNPLab requires a working Python installation and can be simply installed using pip:
|
|
All requirements are automatically installed.
Processing 1D Spectra
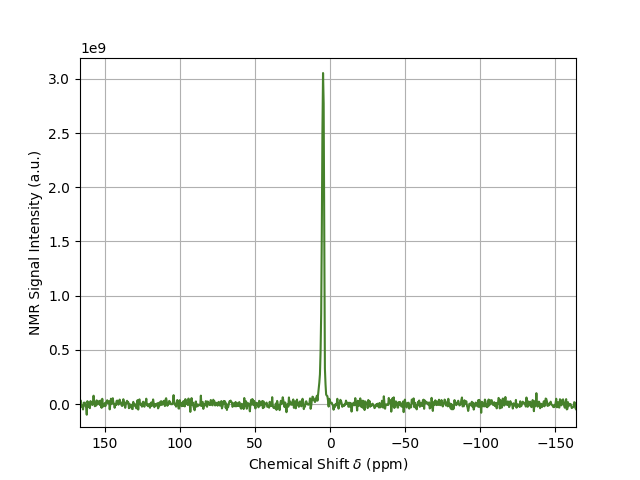
A typical processing and plotting script is shown below:
|
|
The general structure of the script is:
- Line 1: Import the DNPLab package.
- Line 3: Load the NMR spectrum. DNPLab can import many different spectrometer formats. The format is automatically detected and a dnpdata object is created.
- Line 4: The attribute of the spectrum needs to be changed to nmr_spectrum to ensure that the plot function
fancy_plotworks properly (this line will not be required in the future). - Line 6-7: Fourier transform the spectrum and apply an autophase routine.
- Line 8: Remove DC offset from spectrum.
- Line 10-11: Plot the NMR spectrum
The result is shown below.
DNPLab has many more features for processing and analyzing NMR data. It can also be used to process EPR data. For more information check out the Online Documentation.
4 - Saving the NMR Spectrum
OVJ provides two different options to save the NMR data:
- by using the OVJ GUI
- by using the OVJ command line.
Saving Data using the OVJ GUI
To save the NMR experiment using the GUI:
- Go to the Acquire Tab and select Future Actions
- Click on save FID (see image below)

Saving Data from the OVJ Command Line
To save the NMR experiment from the OVJ command line:
- Type the command
save - Enter a name (e.g. mydata). Do not add an extension to the file name
- Press return
The data will be saved and a study is created automatically.
Location of Saved Data
Assuming a default installation of OVJ, the data can be found in the ‘mydata’ subfolder in the vnmrsys/data folder:
|
|