This is the multi-page printable view of this section. Click here to print.
The Bridge12 Q-Band Spectrometer
- 1: Overview
- 2: Getting Started
1 - Overview
The Bridge12 Q-Band spectrometer is a compact EPR spectrometer for pulsed EPR spectroscopy.
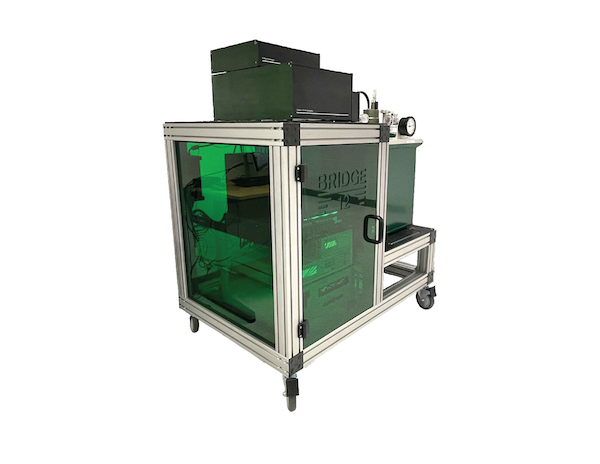
The main features of the system are:
- Compact magnet with integrated liquid cryogen-free (dry) cryostat (more information)
- Modern microwave electronics. Pulse sequences are entirely controlled by an AWG (more information)
- Solid-state microwave amplifier (more information)
- Loop-gap resonator for maximum bandwidth and sensitivity (more information)
For more information about the system visit the Q-Band Spectrometer Page or reach out at info@bridge12.com.
2 - Getting Started
In this section we give a general overview how to operate the Bridge12 Q-Band pulsed EPR spectrometer, which will include the following steps:
- Loading the sample into the spectrometer
- Optimizing the microwave pulse parameters
- Record an echo-detected field sweep EPR experiment
- Perform a PELDOR/DEER experiment
All experiments were performed on our in-house spectrometer, using a sample of a ruler molecule with a concentration of 100 µM in polystyrene. Experiments were performed at a temperature of 50 K.
Important
These are sample instructions recorded on equipment in our lab. Actual parameters may vary depending on your specific system configuration, sample, or sample temperature.
This documentation was prepared using SpecMan4EPR version 3.6.4. If you use a different version some features are maybe named differently or the layout of some windows has changed.
Preparing SpecMan4EPR
When you first start SpecMan4EPR, the software will make sure it can connect to all devices. Once the initialization routine finishes you will see a window very similar to the one shown in the figure below.
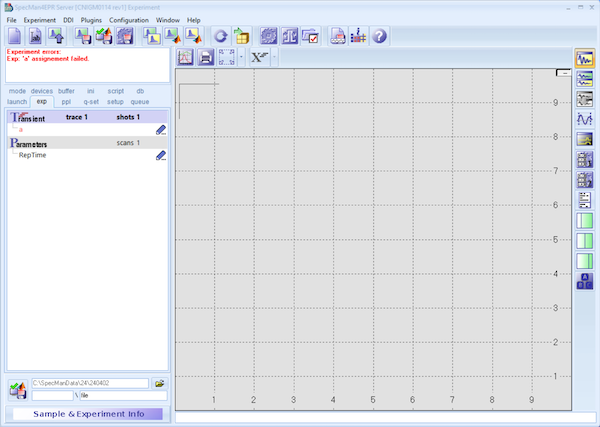
We recommend to open the following windows to operate the spectrometer:
- Open the
Scope Windowand activate the digitizer trace. This will be helpful to see the integration limits for the digitizier. - Open the
Pulse Programmerwindow to show the pulse sequence. - Open the top
User Panel, this will give you convenient access to bridge parameters such as the microwave frequency, video amplifier gain, or the microwave phase. - Optionally, open the
Log Window. This is helpful to see messages from the SpecMan4EPR software.
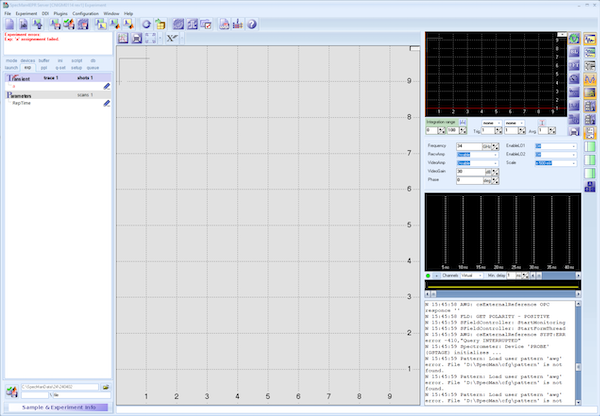
Once you opened all these additional panels, the SpecMan4EPR window should look similar to the one shown below.
What’s next?
2.1 - Inserting a Sample and Adjust the Resonator Coupling
The following section provides a step-by-step procedure how to insert the sample into the EPR probe and adjust the iris coupling of the resonator.
To confirm that the sample is inserted into the microwave resonator correctly, we will observe the microwave tune dip of the resonator.
Inserting the Sample
Make sure SpecMan4EPR is running.
To insert the sample follow these steps:
- Switch the spectrometer into operate mode
- From the Experiment Panel select the
modetab - Click the Operate button. This will enable all synthesizers
- From the Experiment Panel select the
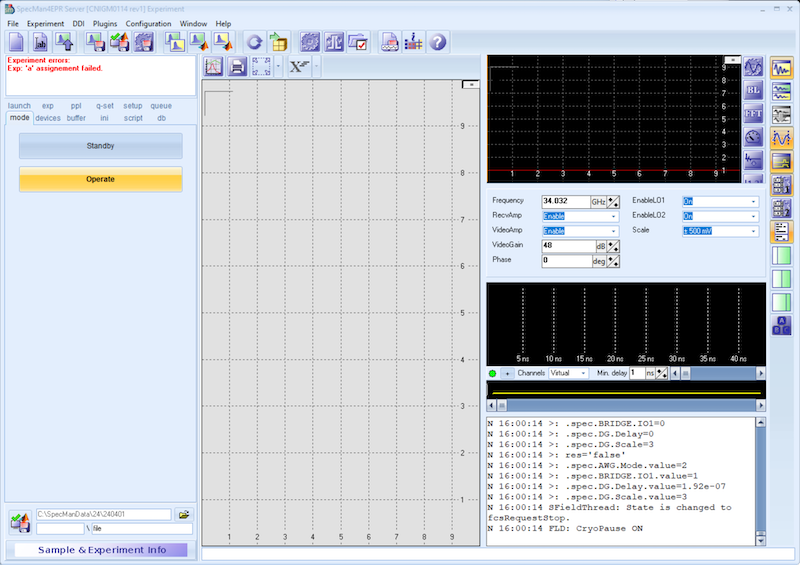
- Open the resonator tune window (
RESONATOR plugin) from the plugins window - Start the tune sweep by clicking the
runbutton (green arrow on bottom left)
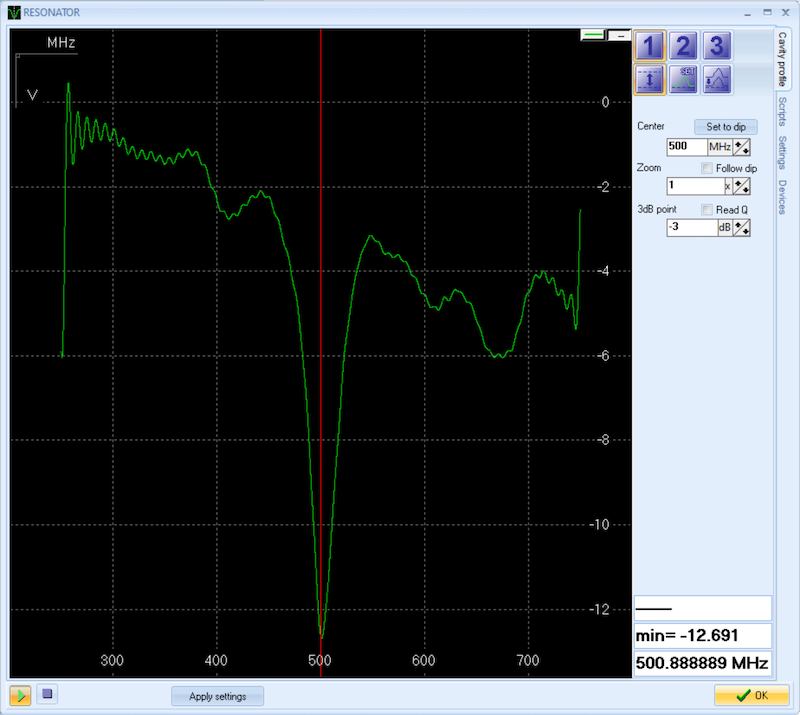
- Make sure the resonator is critically coupled. For this, the resonator iris is completely inserted into the resonator. This corresponds to a micrometer reading of 0 mm.
To insert the sample:
- Make sure the helium gas pressure inside the cryostat is slightly above atmospheric pressure (> 0.1 bar). Note, the pressure gauge shows a value of 0 bar, when the pressure inside the cryostat is close to atmospheric pressure.
- Once the pressure in the cryostat is slightly above atmospheric pressure, it is safe to remove the bling plug. For this loosen the nut and pull out the plug. You will feel a stream of cold helium gas exciting the cryostat. This will prevent air and moisture entering the sample space.
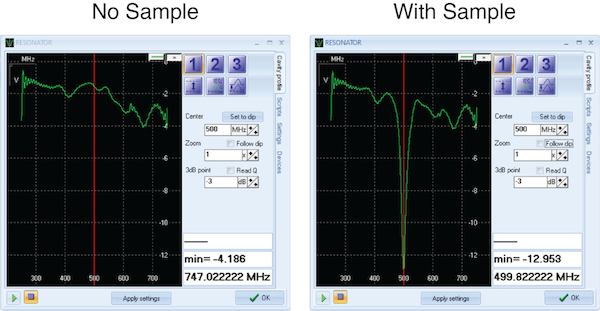
- Slowly insert the the sample stick and lower it into the resonator. The sample stick has holes at the top and the bottom to release the helium gas coming from the probe. While lowering the sample stick, observe the tuning picture of the resonator. Once the sample enters the resonator, the tuning dip of the resonator will be visible (see figure below).
- Once the sample is fully inserted into the resonator, tighten the nut at the top of the probe that holds the sample stick. This nut should just be hand-tight. Do not use any tools (e.g. pliers) to close the nut.
- Close the valve to the helium gas supply.
- Start the pump and open the valve to the pump to lower the pressure inside the cryostat to about -0.5 bar. The exact pressure is not important.
- Close the valve to the pump and wait for a couple minutes until the temperature inside the cryostat stabilizes.
In side the tune window you can zoom into the tune picture by clicking the up and down buttons.
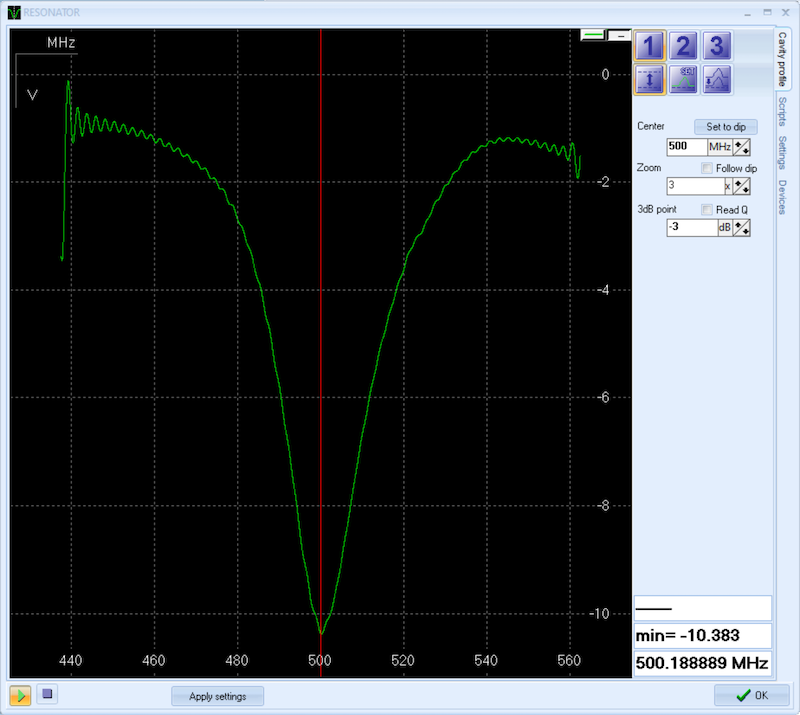
Overcoupling the Resonator
For pulsed EPR experiments the resonator must be overcoupled to reach the maximum resonator bandwidth.
- Before you adjust the resonator iris to overcouple the resonator, make sure the microwave frequency (red vertical line) is set to the tuning dip. The microwave frequency is adjusted in the Control Panel (see figure above).
- Slowly turn the micrometer screw to overcouple the resonator. This will raise the iris and the tuning dip will get broader. The tune dip will also shift ub by about 90 MHz. For maximum overcoupling set the height of the iris to 7 mm.
- For DEER experiments on nitroxide-based spin labels you don’t have to adjust the microwave frequency. The shift of the dip is about 90 MHz, which corresponds to the frequency separation of the pump and observe pulse. When using different paramagnetic species the frequency may have to be adjusted. However, keep in mind, the resonator bandwidth is > 400 MHz for the Bridge12 QLP probe.
- To exit the tune mode, click the
stopbutton (click the square icon, bottom left) and click theOKbutton to close the window.
The spectrometer is ready for the first experiment.
What’s next?
2.2 - Optimizing the Microwave Pulse Parameters
In this section we provide the general procedure how to optimize the microwave pulse parameters for the PELDOR/DEER experiment.
Set the Magnetic Field
- Use the microwave frequency that was set in the microwave bridge
Control Panelto calculate the maximum field for a nitroxide radical. This can be done using the provided Python script.- In this example the microwave frequency is 34.032 GHz and the script returns a field value of 1.21896 T.
- Next, open the window to control the field. From the
DDI menuselectSet Field form, FLD. - Enter the field value and click the
Set Fieldbutton.
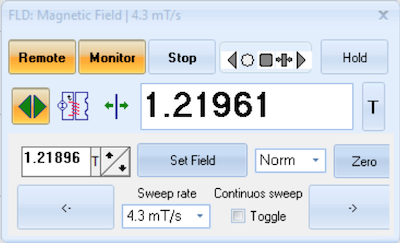
- Wait until the desired field value is reached. When the magnetic field is sweeping, the temperature of the Magnet Switch will typically rise from about 5.9 K to about 8 K. Once the desired field is reached, the temperature returns to its base temperature of about 5.9 K.
- Close the magnet control window.
Optimizing the Pulse Parameters
To optimize the pulse parameters follow these steps:
- Load a new experiment. From the
Filemenu, selectNew Experiment. Scroll to theTwo-Pulse Echoexperiment and click on it to load the experiment. This will load some default pulse parameters, which will be a good start for the optimization. - Next, start the pulse sequence by hitting the
Tunebutton. Once the experiment starts, you should see an echo in theScopewindow to the left.
In the next step we will adjust the video amplifier gain and the microwave phase. This is an iterative process and you have to adjust both parameters. Make sure the Modulation Frequency parameter is set to 500 MHz.
- In the microwave bridge
Control Paneladjust the video amplifier gain. Observe the echo amplitude and set the video amplifier gain to a value so the echo amplitude is not clipped. - In the same window adjust the microwave phase to maximize the echo amplitude (real part of the complex signal, green trace).
The video amplifier gain should be adjusted to a value that the echo amplitude is about 75 % of the maximum (horizontal red line). For small echo amplitudes, you can also adjust the scale in the same window. This will adjust the input scale of the digitizer.
In the next step, we will find the optimum value for the microwave power. SpecMan4EPR allows the user to make almost every variable of the experiment an axis of the experiment. We will use this feature of the software to find the correct pulse amplitude.
-
Right click on the
ampvariable in the Parameter section and selectY axisto assign the parameter to the y axis. -
In the section for the y axis, set the
sizeof the axis to 101 points. -
In the line below, set the sweep range to
"0 step 0.01". This will you to step theampparameter from 0 to 1 in steps of 0.01 using the slider. -
To start the experiment, click the
tunebutton. -
Move the slider with the mouse to maximize the echo amplitude.
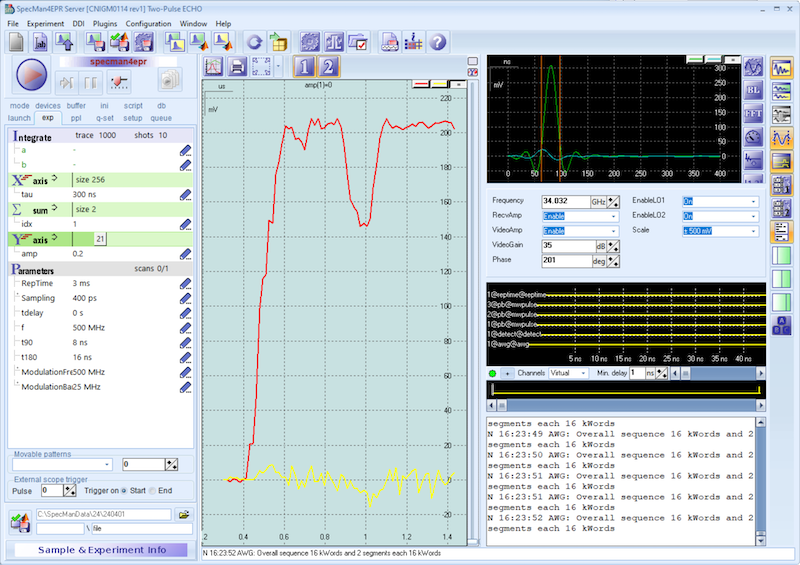
- Find the optimum pulse amplitude for a two-pulse echo using 8 and 16 ns for the pi/2 and pi pulse, respectively. In this example the optimum value is at 0.2 (21st step).
- Change the pulse length the for 90º and 180º pulse to 16 and 32 ns, respectively, and repeat the optimization. In this example the optimum value for the 16/32 echo is at 0.08. This value should be approximately half of the value determined for the 8/16 ns echo.
While the tune mode is running, SpecMan4EPR will integrate the area of the echo and record the value in the display. Observe the value (red trace in figure below) and optimize for the maximum echo amplitude.
-
Once you found the optimum values stop the tune mode by clicking the
tunebutton.
Record reference T2 decay
In the next step, we will record a two-pulse echo decay as a reference spectrum. This will give you and idea of the setting for the maximum dipolar evolution time. To record the T2 decay follow these steps:
- Reload the experiment. From the
Filemenu, selectNew Experiment. Scroll to theTwo-Pulse Echoexperiment and click on it to load the experiment. - Set the
ampparameter (pulse amplitude) to the value determined above. In this example we use the parameters for the 8/16 ns echo. - Hit the
runbutton to start the experiment.
It will take about 15 s to compile the pulse sequency and upload it to the AWG. Once the sequence is uploaded the experiment will start and the results are shown once the experiment finishes (see figure below). Overall duration for this experiment is about 26 s.
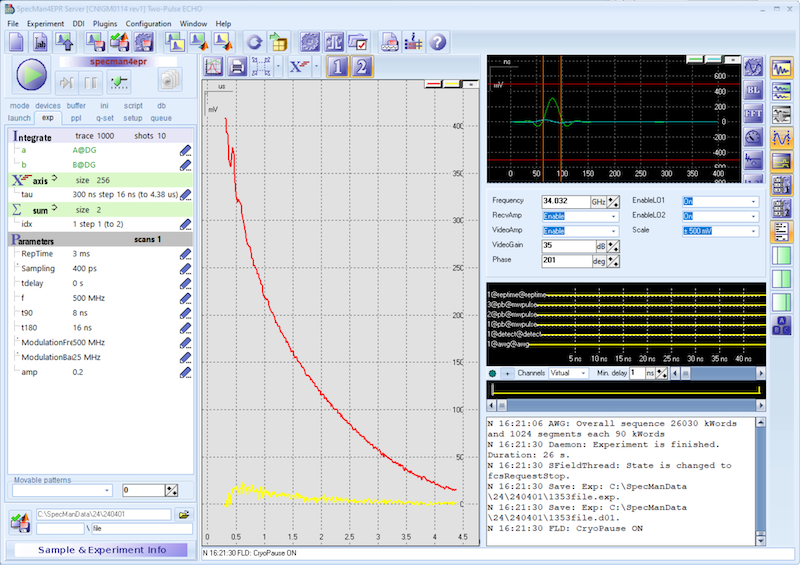
For this particular sample we pick a maximum dipolar evolution time of about 2 µs.
What’s next?
2.3 - Record a Field Sweep Spectrum
In this section we will provide general instructions on how to record an echo-detected field sweep spectrum.
- First, load a new experiment. From the
Filemenu, selectNew Experiment. Scroll to theField Sweep Echo in Set Modeexperiment and click on it to load the experiment. - When you load the experiment SpecMan4EPR will set all experimental parameters to the default values loaded from the template. Adjust the parameters to the values determined in the previous experiments, such as pulse length, pulse amplitude, …
- Under X-axis set the field range and number of points for the experiment. To get started use the field sweep range, that is calculated by the Python script. In this example we will sweep the field from 1.212 T to 1.232 T. enter the phrase “1.212. to 1.232” under
Field. The step size is automatically calculated. - Hit the run button to start the experiment.
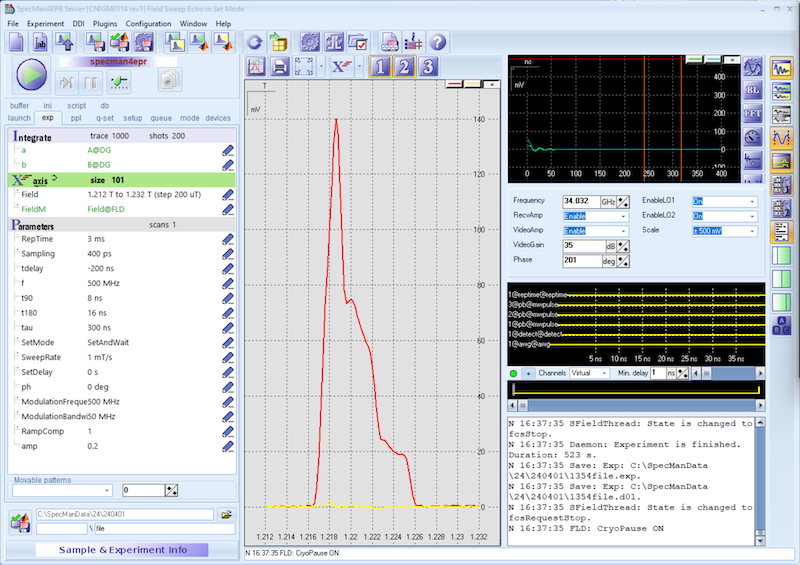
Once the experiment is finished, data will be saved automatically by SpecMan4EPR. In this particular experiment the software will set a magnetic field and will wait for the field to be settled (SetMode: SetAndWait). While this is the slowest mode to record a spectrum, it will give the most accurate results. At the end of the experiment SpecMan4EPR will return the field to the start value.
Note down the value of the magnetic field for the maximum echo amplitude. You can enable the cursor by enabling the Hint mode:
- Click the right button in the top right corner of the spectrum (see figure below)
- From the drop-down menu select Show Hint.
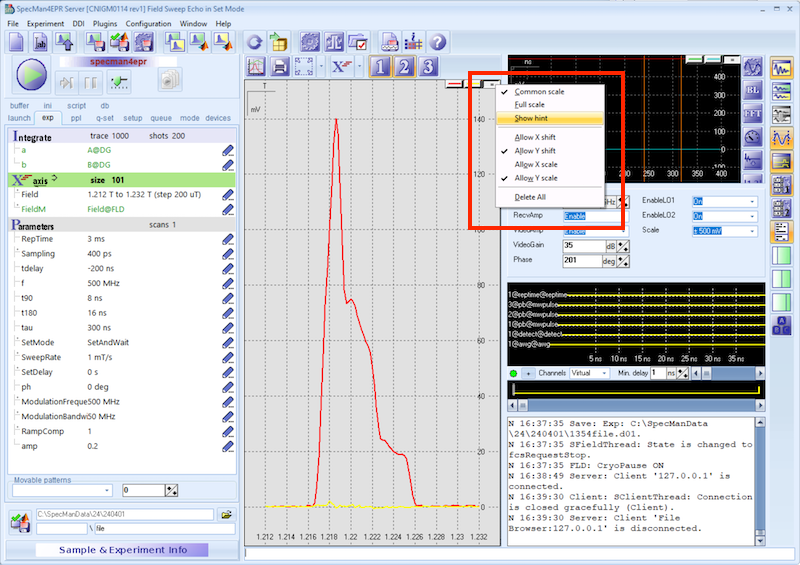
In this particular experiment the field position for the maximum echo amplitude is 1.21865 T.
For nitroxide spin-labels at Q-Band frequencies the separation between the pump and the observe pulse is typically set to 90 MHz, corresponding to 90 MHz / 2.804 = 3.2097 mT.
The field position for the observe pulse is therefore 1.21865 T + 3.2097 mT = 1.221859 T.
What’s next?
2.4 - Run a B1 Nutation Experiment
In this section we will provide general instructions on how to run a nutation experiment to determine the optimum length of the inversion pulse.
The nutation is a three pulse experiment. The sequence starts with a nutation pulse followed by a long delay and a two-pulse echo detection sequence. During the experiment the pulse length of the nutation pulse is increased to observe the Rabi oscillation.
To perform the nutation experiment follow these steps:
- Start by loading the experiment. From the
Filemenu, selectNew Experiment. Scroll to theTwo Pulse Echo Nutationexperiment and click on it to load the experiment. - Make sure the magnetic field is still set to a value corresponding to the maximum echo amplitude (here 1.21865 T).
- In the experimental parameter section set the parameter
amp_Nutto 1. This is the amplitude for the nutation pulse and we will just use maximum power. - Set pulse length to p_90 = 16 ns and p_180 = 32 ns, set the amplitude for the detection pulses to 0.08 (this is the value that was previously determined).
- Hit the tune button and adjust the integration interval in the scope window (vertical orange lines).
- To start the experiment, hit the
runbutton.
The result of the experiment is shown in the figure below.
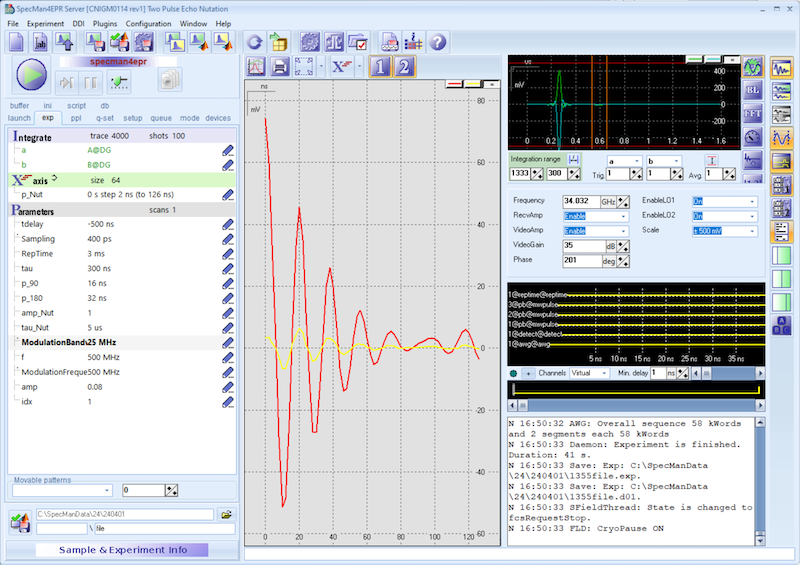
Use the cursor and Hint Mode to determine the pulse length of the inversion pulse. In this case it is 10 ns for an pulse amplitude of 1.
Note
The Bridge12 QLP resonator has a bandwidth of > 400 MHz. Therefore, you don’t have to repeat the nutation experiment at the observe field position.
What’s next?
2.5 - Run a PELDOR/DEER Experiment
If you followed the instructions of the previous sections you have all parameters to run a PELDOR/DEER experiment. In this section we show how to setup a PELDOR/DEER experiment. Note, that some parameters such as shots, trace, scans … are set to default values. We recommend to start with these parameters and adjust them later if needed.
First, we need to move the magnetic field to the observe field position:
- Open the window to control the field. From the
DDI menuselectSet Field form, FLD. - Enter the field value for the observe field (here 1.2218 T) and click the
Set Fieldbutton. - Wait for the field to settle.
In the next step we can setup the PELDOR/DEER experiment:
- Start by loading the experiment. From the
Filemenu, selectNew Experiment. Scroll to the4-Pulse DEERexperiment and click on it to load the experiment. - Enter the experimental parameters corresponding to the values determined in the previous section:
- Set the pulse length for the observe pulses (t90, t180), the 16 and 32 ns, respectively.
- Set the amplitude for the observe pulses (amp) to 0.08. This value was determined in the Optimizing Pulse Parameters section.
- Set the value for the maximum dipolar evolution time (tau2) to a value of 1.932 µs.
- Set the length of the pump pulse (t_eldor) to 10 ns. This value was determined in the Run a B1 Nutation Experiment section.
- Set the amplitude of the pump pulse (amp_eldor) to a value of 1 (maximum power).
- Set the frequency of the pump pulse (f_ELDOR) to a value of 590 MHz. The detection is at 500 MHz. Therefore, the overall offset of the pump pulse, with respect to the observe pulse is 90 MHz.
- Set the parameter t, the position of the pump pulse to “-100 ns step 16 ns” and the size to 126. Here you should pay attention to the value in the bracket. SpecMan4EPR calculates this value and it should be lower than the value for tau2, the maximum dipolar evolution time.
- Enter the number of scans that you would like to run.
- Hit the run button to start the experiment.
When you hit the run button, SpecMan4EPR first calculates the entire pulse sequence, including the phase cycle (SpecMan4EPR will step through all variables and you can see this for the different axis). The full pulse sequence is then uploaded to the AWG and the experiment is started. Once a scan is finished and the data is transferred to SpecMan4EPR.
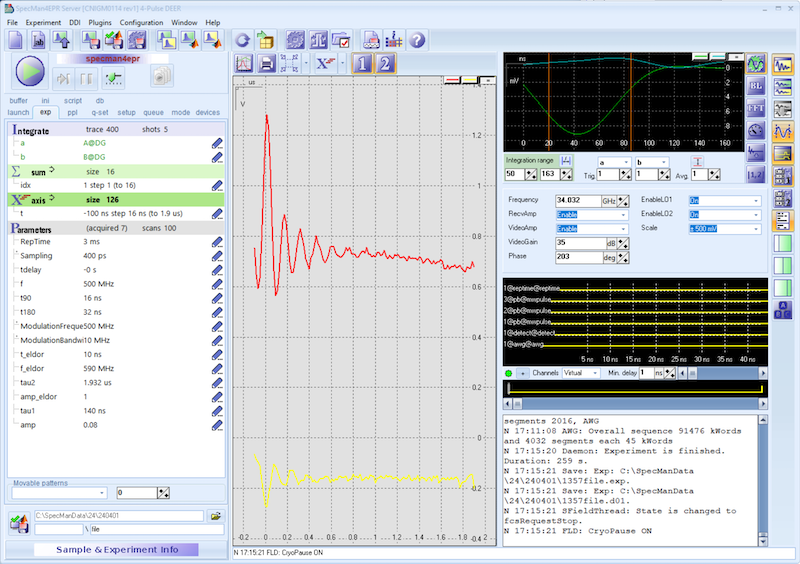
Once the experiment is finished, SpecMan4EPR will automatically save the results. If you want to stop the experiment during the acquisition, you have two choices:
- Hit the
Runbutton. This will immediately stop the experiment. In this case the data is not saved automatically. - Hit the
Finishbutton. SpecMan4EPR will finish the current scan before stopping the experiment. The experimental data will be saved.
Setup Overnight experiment
If long signal averaging is required to obtain a sufficient signal to noise ratio, we recommend running the experiment in a queue.
- In the experiment panel, select the
queuetab (see figure below) top open the queue window.
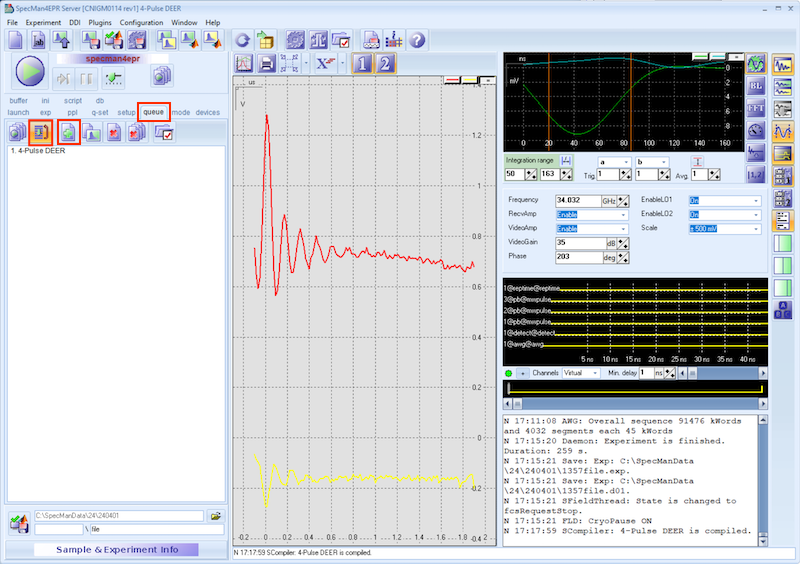
- Click
+ button(with the green + sign) to add an experiment to queue. This will queue an experiment using the parameters that are currently set in the parameter section. - Click the
loop button. By selecting this option, SpecMan4EPR will perform the experiments in the queue (here only ne experiment is added to the queue) and then start over again once all experiments in the queue are finished. The experiment is saved once it finishes. - To start the queue, press the
queuebutton.
What’s next?
2.6 - Shutting Down the Spectrometer
Once all experiments have finished you can shut down the spectrometer.
Shutting down the spectrometer means:
- Closing SpecMan4EPR (if desired)
- Switching of the microwave amplifier and Q-Band extension
- Ramping down the magnetic field to 0 T
Shutting down the spectrometer DOES NOT MEAN:
- Switching off the helium compressor
The helium compressor should only be switched off for maintenance or if the spectrometer is not used for a longer time.
Removing the Sample
Follow these steps to remove the sample:
- Critically couple the resonator. This will make it easier to find the resonator the next time. Turn the micrometer screw to 0 mm.
- Open the resonator tune window (
RESONATOR plugin) from the plugins window - Start the tune sweep by clicking the
runbutton (green arrow on bottom left)
You should see a clean tuning picture (see figure below)

To remove the sample:
- Make sure you have the blind plug within reach.
- Make sure the helium gas pressure inside the cryostat is slightly above atmospheric pressure (> 0.1 bar). Note, the pressure gauge shows a value of 0 bar, when the pressure inside the cryostat is close to atmospheric pressure.
- Once the pressure in the cryostat is slightly above atmospheric pressure, it is safe to remove the sample stick. For this loosen the nut and slowly pull out sample stick. While raising the sample stick, observe the tuning picture of the resonator. Once the sample is pulled out of the resonator, the tuning dip of the resonator will disappear (shifted to higher frequency).
- Slowly keep raising the sample stick. The sample stick has venting holes at the top and bottom of the G10 section to release helium gas from the cryostat and to purge the sample stick and to prevent air and moisture to enter the sample space.
- Once the sample stick is removed from the cryostat secure the sample and either insert a new sample or close the cryostat using the blind plug and tighten the nut. This nut should just be hand-tight. Do not use any tools (e.g. pliers) to close the nut.
- Once the cryostat is closed, close the valve to the helium supply.
- Start the pump and open the valve to the pump to lower the pressure inside the cryostat to about -0.5 bar. The exact pressure is not important.
- Close the valve to the pump.
Ramping Down the Magnetic Field
Once the sample is removed the magnetic field can be ramped down.
- Open the window to control the field. From the
DDI menuselectSet Field form, FLD.
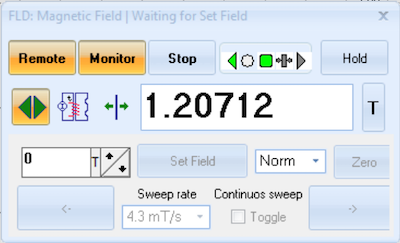
- Enter 0 in the field for the magnetic field and hit return.
- Under Sweep rate, select the highest sweep rate.
- Click the
Set Fieldbutton to ramp down the magnetic field. - Wait for the field to reach 0 T.
Switching the Spectrometer to Standby Mode
To switch the spectrometer into operate mode:
- Select the
modetab from the Experiment Panel. - Click the
Standbybutton. This will disable all synthesizers.
The spectrometer is in standby mode. It is safe to switch off the amplifier and the Q-Band extension.